New features for Artifical Intelligence (AI)
In this post, we are very glad to introduce the new web app dedicated to customers who use our service for AI, Machine Learning purposes. Besides existing system features similar to app.gpuhub.net, we have been developing many new and useful features for AI to enable you to take advantage of our service in the easiest and most convenient way.
Here are some new features:
CONTENTS
- 1.Terminal: Manipulate commands directly on the web app (similar to SSH)
- 2. Jupyter Notebook: the third-party application to run commands or train models
- 3. Monitor process: allows you to monitor processes without accessing the remote server
- 4. Monitor Log File: This allows you to manage and view log files
1.Terminal: Manipulate commands directly on the web app (similar to SSH)
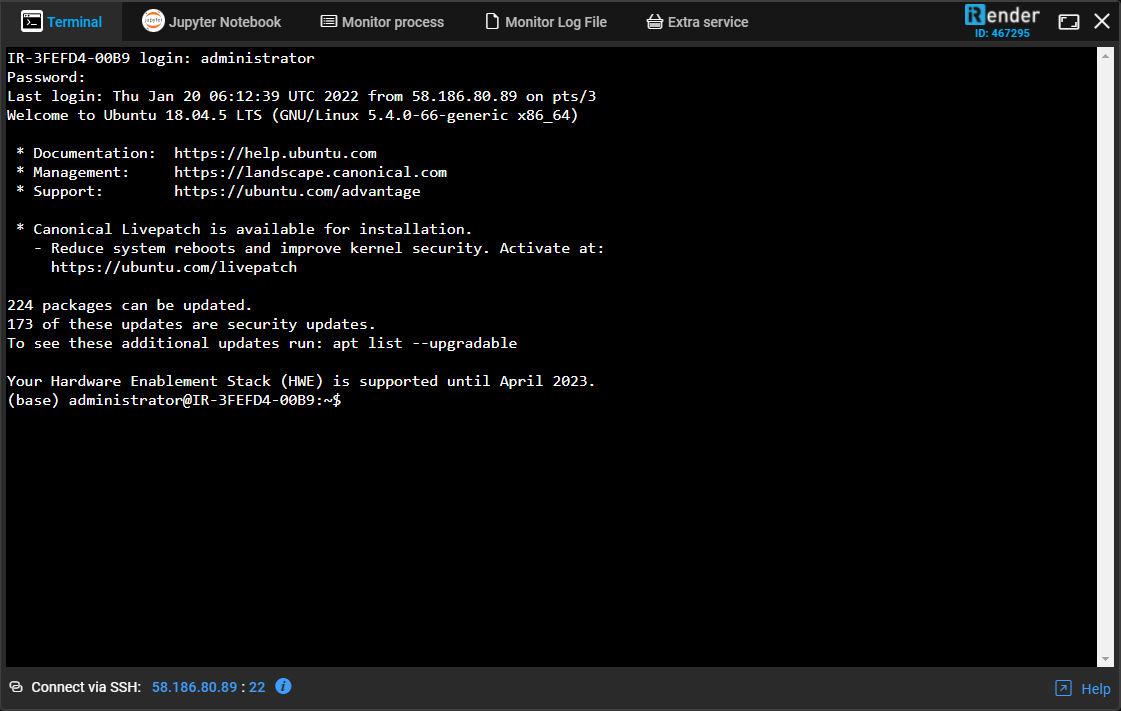
You can use Terminal once the server has been booted successfully. As normal, there are 2 ways to use Terminal: (1) connect to the RDP file to access the remote server, (2) use the third party app to connect via SSH such as the putty, window command prompt.
However, with our new function, you can still use the Terminal without connecting via SSH or connecting to RDP. What you need to do is:
- Once the server has been booted successfully, click Function.
- Next, click the Terminal tab. Now, you can use Terminal here.
2. Jupyter Notebook: the third-party application to run commands or train models
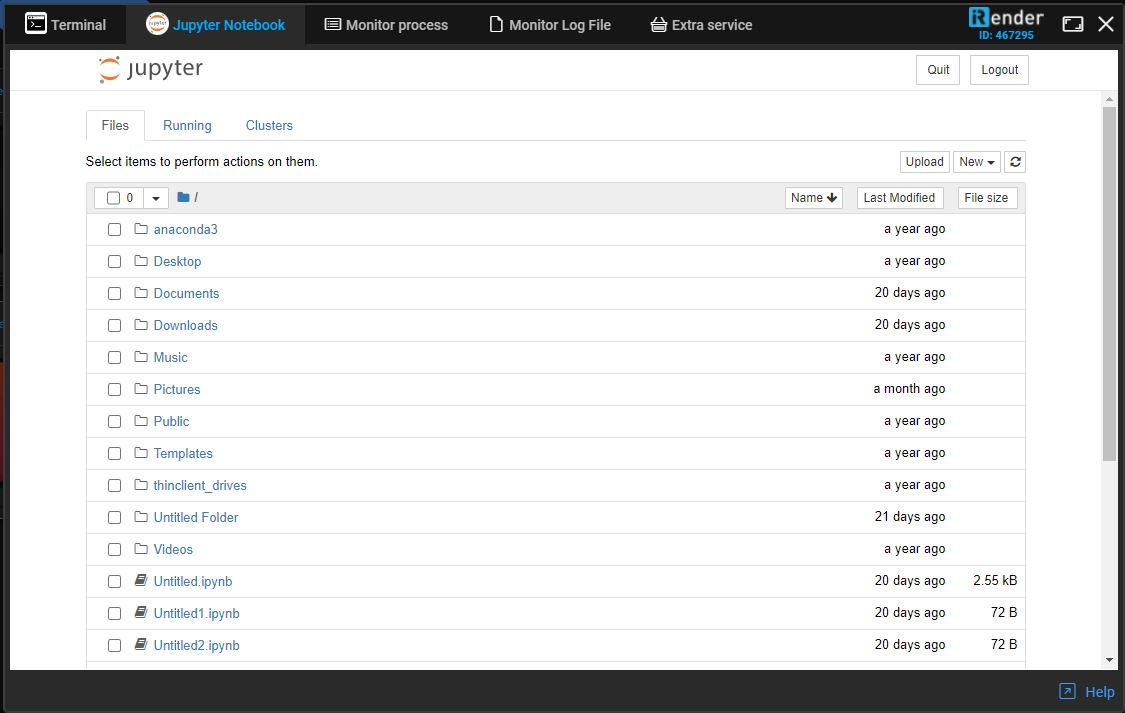
Normally when you use Jupyter Notebook to run commands or train models, you need to connect to the remote server through RDP, install it, and then use it. Interestingly, with our Function, you can easily use Jupyter Notebook directly on our web app.
- Once the server has been booted successfully, click Function.
- Next, click the Jupyter Notebook tab. Now, you can use it to run commands or train models here.
3. Monitor process: allows you to monitor processes without accessing the remote server
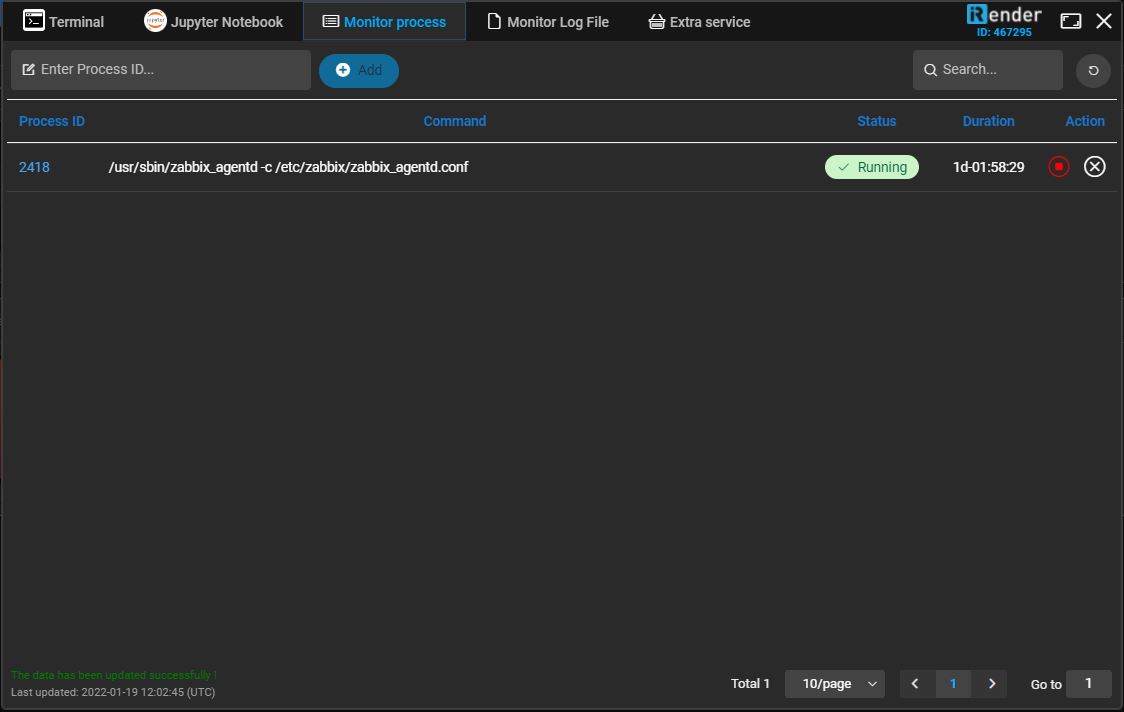
Instead of accessing the remote server to find and track the process created, now you easily monitor the process by using our Monitor process function on our web app. This function allows you to know if the process is running or not, how long the process has been running, or you can kill the process. What you need to do is:
- Once the server has been booted successfully, click Function.
- Next, click the Monitor process tab, enter Process ID.
Looking at the table here, you can see that
- Process ID: to show the ID of the process
- Command: to show the command to run the process
- Status:
+ Loading: new data is being updated (updated every minute)
+ Running: the process is running
+ Killing: the process is stopping
+ Killed: the process was stopped (will be removed from the list)
- Duration: to show the time that the process has run.
4. Monitor Log File: This allows you to manage and view log files
Normally when you want to check the error, you need to access the remote server, then open the log file to read which error, which line is wrong. We are giving you the Monitor file log on our web app which is much more convenient. By entering the Log File Path and Log File Name that you want to monitor into the Monitor Log File tab, you can monitor and manage this log file.
It shows the last 1000 lines of the log file.
- Once the server has been booted successfully, click Function.
- Next, click the Monitor Log File tab
Looking at the table here, you can see that:
- Name: to show the name of the log file when adding
- File path: to show the path of the log file on the remote server
- File exists:
+ Loading: new data is being updated (updated every minute)
+ Exist: check if the file exists on the remote server
+ Not exist: check if the file does not exist on the remote server
- View file log: show the last 1000 lines of the log file (click the eye icon)
- Remove file log from the list: remove log files from the watch list (not remove log files on the remote server)
Why us?


